
Geographic information systems (GIS) are defined as the foundational technology for integrating spatial data across transport networks, demographics, and land use to support evidence-based planning decisions. The role of GIS in transport planning extends well beyond map production. Platforms like ArcGIS and PTV Visum enable planners to measure accessibility, model network performance, and compare infrastructure scenarios before a single metre of road is built. A 2026 Frontiers study demonstrated that GIS-based interventions in a heritage city improved modal share from 14% to 30% and reduced average travel time by 40%. That result illustrates what separates GIS from conventional planning tools: it converts spatial complexity into measurable outcomes.
How does GIS support accessibility analysis in transport planning?
Accessibility analysis is one of the most direct GIS applications in transportation, and it produces results that planners can act on immediately. GIS classifies travel-time reachability into intervals, typically 15, 30, 45, and 60 minutes, and renders those intervals as isochrone maps or colour-coded matrices. The visual output makes spatial disparities obvious to both technical teams and non-specialist stakeholders.
PTV Visum combines spatial land use data with network performance modelling, allowing planners to identify where transit provision falls short relative to population density. The Austin case study published by PTV Group showed how this approach pinpoints mobility gaps that aggregate statistics would obscure entirely.
A critical methodological point: composite accessibility scores can mask the underlying causes of poor service. An open-source GIS workflow developed for Valencia, Spain, maintains three distinct indicators:
- Service strength: frequency and capacity of available routes
- Geometric proximity: physical distance from a stop or station
- Demographic sensitivity: the proportion of vulnerable or transport-dependent residents in each zone
Keeping these indicators separate produces far clearer diagnostics. A zone may score well on proximity but poorly on service strength, which points to a scheduling problem rather than an infrastructure gap. Conflating the two leads planners to the wrong solution.
| Indicator | What It Measures | Planning Use |
|---|---|---|
| Service strength | Route frequency and capacity | Identifies scheduling deficiencies |
| Geometric proximity | Distance to nearest stop | Flags physical access barriers |
| Demographic sensitivity | Vulnerable population share | Guides equitable investment decisions |
Pro Tip: When commissioning an accessibility study, request that service strength, proximity, and demographic sensitivity are reported as separate outputs. A single composite score is easier to present but harder to act on.
How does GIS optimise multimodal transport network planning?
Multimodal planning is where GIS delivers some of its most tangible benefits, because the spatial discontinuities between road, rail, and port networks are rarely visible until they are mapped together. GIS overlays these layers simultaneously, making gaps and conflicts apparent before they become costly construction problems.

India’s PM Gati Shakti programme is the most cited large-scale example of this approach in current practice. The PM Gati Shakti GIS platform identified 156 connectivity gaps across freight corridors and used that analysis to plan nearly 9,000 km of new roads and 27,000 km of railways. The platform overlays infrastructure corridors, land records, and environmental data simultaneously. That pre-construction visibility is what prevents the coordination failures that typically inflate project costs and timelines.
The practical workflow for multimodal GIS analysis follows a logical sequence:
- Load authoritative base layers: road network, rail alignments, port boundaries, and administrative boundaries from verified sources.
- Overlay land use and environmental constraints: flood zones, protected areas, and existing utilities.
- Run connectivity gap analysis: identify locations where mode transfers are physically impossible or operationally inefficient.
- Prioritise interventions: rank gaps by freight volume, passenger demand, or strategic corridor importance.
- Model scenarios: compare proposed alignments against cost, environmental impact, and connectivity improvement metrics.
The spatial overlay capability is particularly valuable for cross-sector coordination. When a highway authority, a rail operator, and a port authority are all working from the same GIS platform, conflicts that would otherwise surface during construction are resolved at the planning stage.
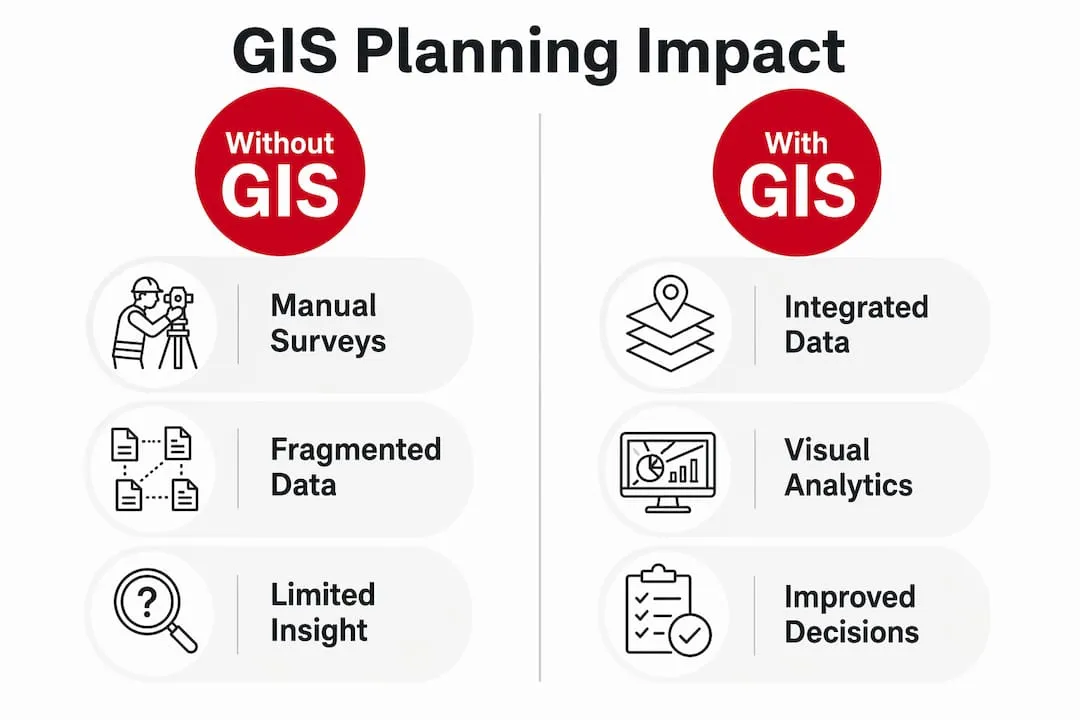
| Planning Approach | Without GIS | With GIS |
|---|---|---|
| Connectivity gap identification | Manual surveys, slow | Automated spatial analysis, fast |
| Cross-sector conflict detection | Post-design, costly | Pre-construction, low cost |
| Scenario comparison | Qualitative, subjective | Quantitative, map-based |
Pro Tip: Before any multimodal corridor study, establish a single authoritative GIS geodatabase that all participating agencies contribute to. Separate datasets held by separate departments are the primary cause of conflicting assumptions in joint infrastructure projects.
What role does GIS play in roadway asset management?
GIS is the system of record for transport asset management, not merely a visualisation layer applied after the fact. State and national transport departments use GIS to create and maintain authoritative road maps, record asset locations, and analyse crash and congestion data to prioritise maintenance and new construction investment.
The Idaho Transportation Department’s iPlan portal is a well-documented example of this approach in practice. iPlan provides web-based access to geospatial transport data, including pavement condition, crash history, and project programming information. The department treats GIS as a governance tool first. Authoritative geodatabases are established and maintained before any analytical work begins. This sequence matters because analysis built on inconsistent or unverified spatial data produces unreliable outputs, regardless of the sophistication of the modelling.
The benefits of GIS in urban transport asset management are most visible in three areas:
- Crash analysis: GIS maps collision locations against road geometry, speed limits, and junction design to identify systemic safety problems rather than isolated incidents.
- Pavement management: spatial analysis of pavement condition data allows maintenance budgets to be allocated by network priority rather than by reactive reporting.
- Project programming: overlaying proposed schemes against existing asset condition data prevents duplication and identifies opportunities to combine works.
Pro Tip: Treat your GIS geodatabase as a living document with formal version control. Transport networks change constantly, and analytical outputs are only as reliable as the underlying data. Schedule quarterly audits of your authoritative layers.
How do recent advances expand the impact of GIS on transport?
The impact of GIS on transport has grown substantially as real-time data integration and enterprise-scale deployment have become standard practice. Traditional GIS was largely static, working from periodic surveys and census data. Current platforms ingest live feeds from traffic sensors, GTFS transit data, and connected vehicle networks.
A 2026 Journal of Engineering and Applied Science paper confirmed that integrating congestion and real-time information with GIS produces measurable improvements in accessibility outcomes and supports dynamic adjustments to public transport operations. The practical implication is that GIS tools for traffic planning can now respond to network conditions in near real time, not just model them retrospectively.
Enterprise GIS deployment represents a structural shift in how transport agencies use spatial data. Esri’s transit leadership research describes GIS as the connective tissue linking planning, operations, and asset management within a single agency. When all departments share the same authoritative geography, decisions made in the planning division are immediately visible to operations teams, and vice versa.
Additional advances shaping current GIS practice in transport include:
- Open-source workflows: tools such as QGIS and Python-based spatial libraries allow smaller authorities to conduct equity-oriented accessibility analysis without proprietary software licences.
- 3D visualisation: urban transport models now incorporate building heights and terrain data, improving the accuracy of noise, shadow, and air quality impact assessments.
- Scenario modelling dashboards: web-based GIS applications allow elected members and community groups to interact with transport scenarios directly, improving the quality of public consultation.
Key takeaways
GIS is the most effective foundation for transport planning because it integrates spatial data, quantifies accessibility, and resolves multimodal conflicts before construction begins.
| Point | Details |
|---|---|
| Accessibility analysis precision | Separate service strength, proximity, and demographic sensitivity indicators for clear diagnostics. |
| Multimodal gap identification | GIS spatial overlays reveal connectivity gaps across road, rail, and port networks before construction. |
| Asset management governance | Establish authoritative geodatabases with version control before conducting any analytical work. |
| Real-time data integration | Live traffic and GTFS feeds extend GIS from static modelling to dynamic operational support. |
| Enterprise deployment | Shared authoritative geography across departments prevents conflicting assumptions in joint projects. |
Why most GIS deployments in transport fall short
The most common failure I see in transport GIS projects is what I call the map-only trap. An authority invests in ArcGIS or QGIS, produces a series of well-designed maps, and then stops. The maps go into a report, the report goes to committee, and the GIS platform sits largely unused between projects. That is not a technology problem. It is a governance problem.
The Idaho Transportation Department’s approach is instructive precisely because it treats GIS as a system of record first. The analytical outputs are only as good as the geodatabase behind them. I have reviewed transport studies where two teams within the same authority were working from different versions of the road network. The resulting conflict was not discovered until the public consultation stage.
The second pitfall is composite accessibility scoring. Presenting a single accessibility index to decision-makers feels efficient, but it destroys diagnostic value. When a zone scores poorly, you need to know whether the problem is a missing bus stop, infrequent services, or a demographic mismatch between provision and need. The Valencia GTFS workflow gets this right by keeping indicators separate. More transport authorities should adopt that discipline.
The third issue is siloed deployment. GIS delivers its greatest value when it is shared across planning, operations, and asset management. The PM Gati Shakti programme worked because every participating agency contributed to and drew from the same spatial platform. That level of coordination is achievable at local authority scale too, but it requires political will as much as technical capability.
GIS is not a reporting tool. It is the analytical infrastructure that makes transport planning defensible, equitable, and efficient. Treat it accordingly.
— Rob
Advance your career in transport planning and GIS
Transport planning roles increasingly require GIS competency as a core skill, not an optional extra. Whether you specialise in accessibility modelling, multimodal network analysis, or asset management, employers across the UK and internationally are actively seeking professionals who can translate spatial data into planning decisions.
Jobs-in-transport has connected transport professionals with specialist roles since 2005. The platform lists positions across highways, traffic management, transportation planning, and transport technology, covering the full range of disciplines where GIS expertise adds direct value. If you are ready to apply your GIS skills to real infrastructure projects, browse current transport planning jobs and set up alerts for roles that match your specialism. The demand for spatially literate transport professionals is growing, and the right opportunity is worth finding quickly.
FAQ
What is the role of GIS in transport planning?
GIS integrates spatial datasets including transport networks, demographics, and land use to support accessibility analysis, network optimisation, and infrastructure impact assessment. It converts spatial complexity into measurable outputs that planners can use to compare scenarios and justify investment decisions.
How does GIS improve accessibility analysis for transport planners?
GIS classifies travel-time reachability into intervals and visualises disparities through isochrone maps and colour-coded matrices. Platforms like PTV Visum combine land use data with network performance to identify mobility gaps across a study area.
What GIS tools are most commonly used in transport planning?
ArcGIS and PTV Visum are the most widely used commercial platforms for transport GIS work. QGIS and Python-based spatial libraries are the leading open-source alternatives, particularly for equity-oriented accessibility analysis using GTFS data.
How does GIS support multimodal freight and passenger planning?
GIS overlays road, rail, port, and environmental data simultaneously to reveal connectivity gaps and coordination conflicts before construction begins. India’s PM Gati Shakti platform identified 156 connectivity gaps across national freight corridors using this approach.
Why is data governance important in transport GIS deployments?
GIS analytical outputs are only reliable when built on verified, consistently maintained geodatabases. The Idaho Transportation Department’s iPlan system demonstrates that treating GIS as a system of record with formal governance is the prerequisite for credible transport project planning.


